
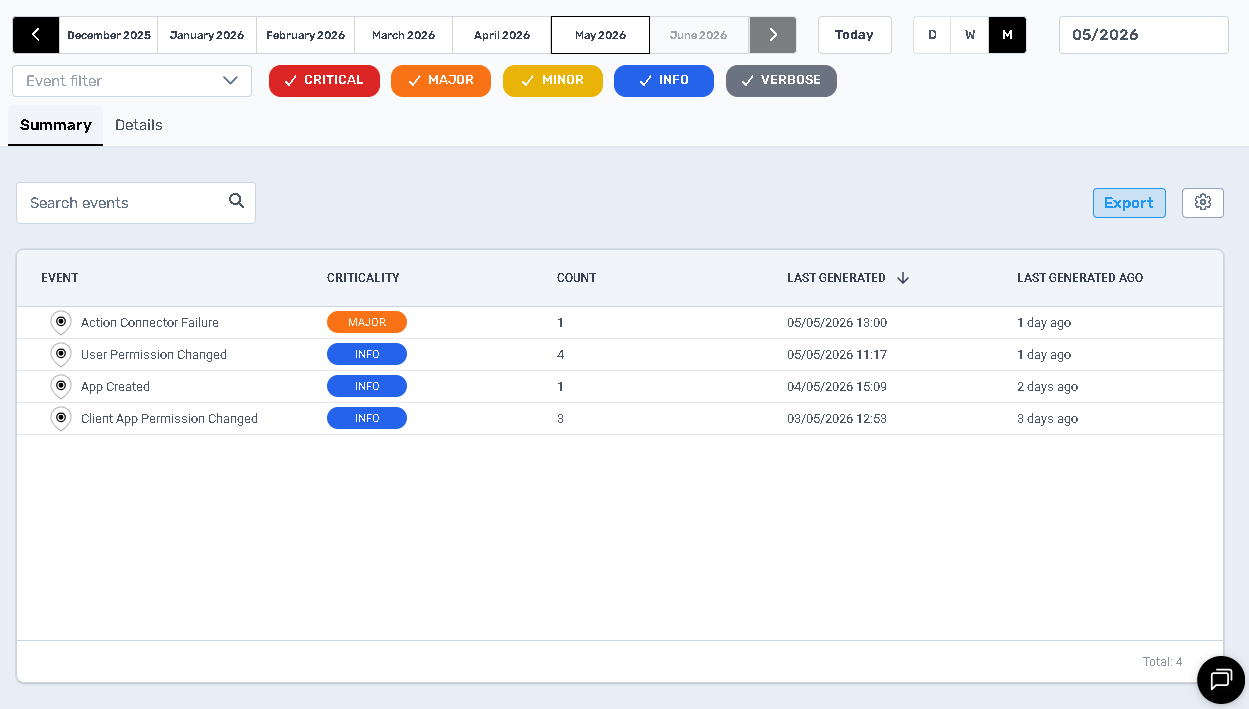
The System Events screen offers a comprehensive look at automated, platform-level activities in Perspio, giving you critical insights into system health, usage patterns, and background processes.
Navigation & Time Range
-
Location: Main Menu → Admin → System Events
-
Date Controls:
-
← / →: Move backward or forward by the selected period
-
D / W / M: Toggle between daily, weekly, or monthly summaries
-
Today: Jump straight back to the current day, week, or month
-
Why it matters: Quickly switching time frames lets you compare trends over different periods—critical for identifying sudden spikes in errors or verifying that fixes have resolved recurring issues.
Views & Controls
| Element | Description & Why It’s Useful |
|---|---|
| Summary tab | Shows aggregated counts of each event type, ideal for spotting which system processes are most active or failing. |
| Details tab | Lists individual system events with timestamps and metadata—essential for deep-dive troubleshooting or audit trails. |
| Search events | Filter by event name, category, or keyword to pinpoint specific issues (e.g., “Connector Failure”). |
| Export | Download visible data as CSV to feed into BI tools, share with stakeholders, or archive for compliance. |
| Settings (⚙️) | Enable/disable categories or adjust retention policies to balance storage costs against audit requirements. |
Summary Table Columns
| Column | What It Shows | Why It Matters |
|---|---|---|
| Event Name | The type of system event (e.g., “Ingress Connector Failure”) | Identifies exactly which process or connector experienced an issue. |
| Criticality | Severity label (INFO vs. MAJOR) |
Prioritizes your focus on serious failures first. |
| Count | Total occurrences in the selected period | Reveals frequency—high counts may indicate systemic problems. |
| Event Category | Grouping such as System, Ingress, Connector, etc. | Helps you understand whether issues stem from integrations, workflows, or core services. |
| Last Generated | Timestamp of the most recent occurrence | Confirms whether a failure is ongoing or has self-resolved. |
Common Use Cases
-
Platform Health Monitoring
-
Why: Quickly surface recurring errors (e.g., failed connector syncs) before they impact downstream data or customer SLAs.
-
How: Sort by criticality to focus on MAJOR events, then drill into the Details tab for root-cause analysis.
-
-
Capacity & Usage Trends
-
Why: Track peaks in workflow creations, geofence triggers, or task completions to align infrastructure scaling and optimize performance.
-
How: Compare weekly/monthly counts to spot growth or unusual drops that might signal configuration issues.
-
-
Alert Configuration
-
Why: Automate notifications for high-severity events—so the right teams are notified immediately when something breaks.
-
How: Use the Summary tab to identify which event names occur often enough to warrant an automated alert or escalation.
-
-
Audit & Compliance Reporting
-
Why: Maintain an immutable record of system actions (e.g., user additions, permission changes) to satisfy regulatory or internal governance requirements.
-
How: Export CSVs regularly via Export and store them in your compliance repository.
-
Best Practices
-
Filter by Criticality First: Always start by filtering out INFO-level events to focus on MAJOR issues that could disrupt operations.
-
Combine Date & Text Filters: Narrow searches to specific windows (e.g., last 24 hours) and keywords to rapidly locate root causes.
-
Automate Exports: Schedule or script periodic CSV exports for long-term trend analysis or audit archives.
-
Review Post-Deployment: After platform upgrades or connector changes, scan the System Events to confirm no new errors have emerged.
-
Adjust Retention Settings: In Settings, set retention periods that meet your compliance policies without overloading storage.