
1. Left-Hand Navigation Menu
A vertical toolbar on the left gives you one-click access to every Perspio module. From top to bottom, you’ll typically see icons for:
-
Home (Perspio's Home Screen)
-
Assets (Menu divided in Asset Inspector, Utilisation and Servicing)
-
Search (search for assets on a map using Proximity Live, Historical and Condition Search)
-
Dashboards (access and create data driven Dashboards)
-
Operations (manage and access Work Orders, Transport and People)
-
Reports (browse, run or schedule reports)
-
Data Explorer (explore asset's datapoints)
-
Groups (create Asset or Security Groups)
-
Geofences (view and edit geofences)
-
Workflows (view and create automated processes)
-
Settings (tenant-wide settings, integrations and assets/devices inventory)
Hover over each icon to reveal its label or click the Logo at the very top to expand the menu and see labels at all times.
2. Top Bar
Across the top you’ll find:
-
Breadcrumb & Home (left) – shows your current page name and lets you set it as Home Screen by starring the page - ★
-
Search Field (center) – quickly look up assets, devices, users, geofences, reports, workflows, or connectors by name or ID. Type at least three characters to trigger search.
-
Status Light – Shows Perspio status, Green for Connected and Blue for Waiting for Live Data.
- Toggle Full Screen –Same results as pressing F11.
- Info – Shows Change Log and Support info.
- Bell – Shows System Jobs status.
3. Top-Right Profile Menu
By clicking on your user:
-
View Profile – Edit user info and change localisation preferences.
-
Logout – Logout of Perspio.
-
Organisation – Edit Organisation preferences.
-
Billing – View Inventory, Invoices, Consumption Graph and Table,
4. Home Screen Dashboard Panels
The main canvas is laid out in cards and charts that give you a snapshot of your entire Perspio tenant:
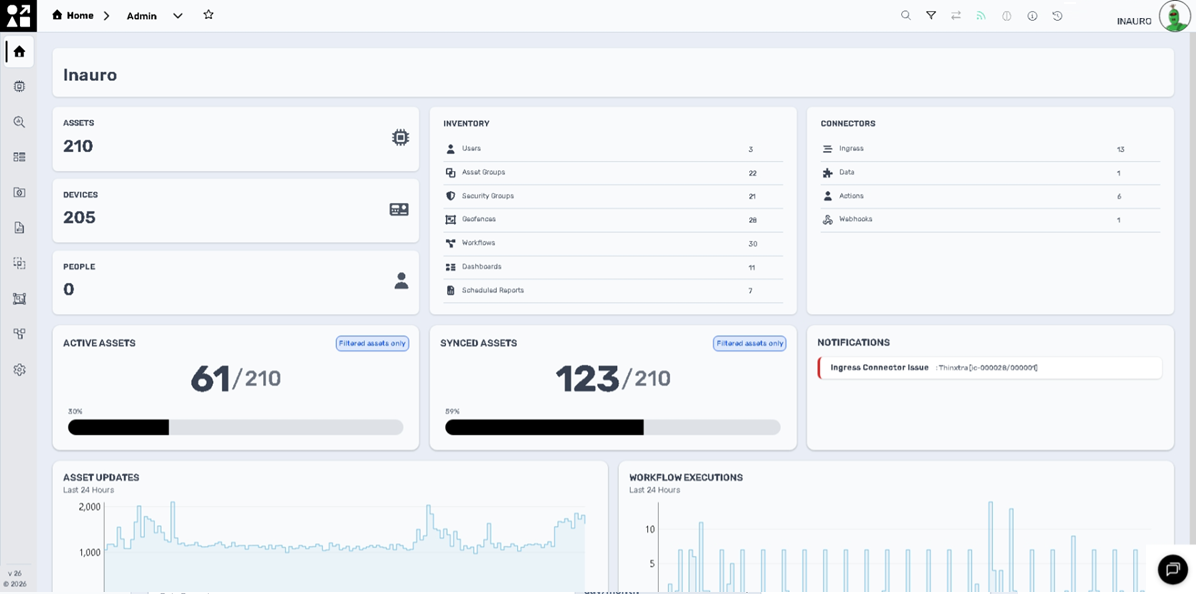
| Panel | What It Shows |
|---|---|
| Tenant | Your organization’s name and logo |
| Assets / Devices / People | Total count of assets, telematics devices, assets and active users |
| Inventory | Quick counts of each object type: Users, Asset Groups, Security Groups, Geofences, Workflows, Dashboards, Scheduled Reports |
| Connectors | How many Ingress connectors, Data mappings, Action connectors, and Webhooks you’ve set up |
| Active Assets | Number (and %) of assets that have reported data recently |
| Synced Assets | Number (and %) of assets whose data is fully synchronized into Perspio |
| System Events | Your three most recent system-level events (e.g., “Task Created,” “Task Completed”) |
| Asset Updates | A time-series chart showing asset data updates over the last 24 hours |
| Workflow Executions | A time-series chart showing how many workflows ran over the last 24 hours |
| Perspio Help | AI Powered Chatbot, NOVA, designed to assist users in navigating Perspio. |
Each card and chart updates in real time so you can immediately spot issues (e.g., a drop in active assets or a burst of workflow errors) and jump straight into the relevant module via the left-hand menu.