
The Reports Module in Perspio provides users with access to a wide range of analytical and operational data across multiple modules—such as Asset Telemetry, Device Health, Utilisation, Billing, and more. Reports help monitor asset performance, operational efficiency, and compliance, while offering tools to export, automate, and share insights within the organisation.
Accessing the Reports Module
To access Reports:
-
Select the Reports icon from the main sidebar.
-
You will be presented with two main views:
-
List View – Displays all reports grouped by category.
-
Card View – Provides quick visual access to commonly used reports.
-
Reports Menu Structure
The left-hand panel displays all available Report Categories. Each category can be expanded to reveal individual reports associated with that data type.
Main Categories
-
Asset Telemetry
Contains reports related to asset movement, performance, and environmental monitoring.
Examples include:-
Activity Detailed
-
Geofence Movement
-
Temperature Compliance
-
Toll Summary
-
Event Detailed
-
-
Device Telemetry
Focuses on device-level data, including:-
Device Health
-
Device Health Extended
-
Communication frequency and data transmission
-
-
Performance & Utilisation
Provides insight into asset usage and operator behaviour:-
Utilisation Summary and Detailed Reports
-
Driver Behaviour IVMS and Summary Reports
-
Activity Summary
-
-
Facility Management
Covers occupancy, temperature, and condition reports for monitored environments. -
Inventory
Includes reports such as:-
Asset Inventory
-
Asset Inventory Utilisation
-
-
Billing
Tracks consumption and usage data used for operational or commercial billing purposes. -
System Events
Records platform-level events, such as workflows, threshold breaches, or automated triggers.
Note: Reports availability is controlled and determined on a tenant level, according to the devices present in the tenant. To know more, please refer to this article.
Report List and Search Controls
At the top of the left-hand panel, you will find key controls for navigation and filtering:
-
Search Bar
Allows you to quickly locate a specific report by typing a keyword (e.g., “Utilisation” or “Geofence”).
The system dynamically filters results as you type. -
Expand/Collapse Arrows
Each report category can be expanded or collapsed for easier navigation through long lists. -
Gear Icon (Settings)
Opens report management settings where you can enable or disable certain reports across the tenant.
This helps declutter the view and ensures users only see relevant reports.
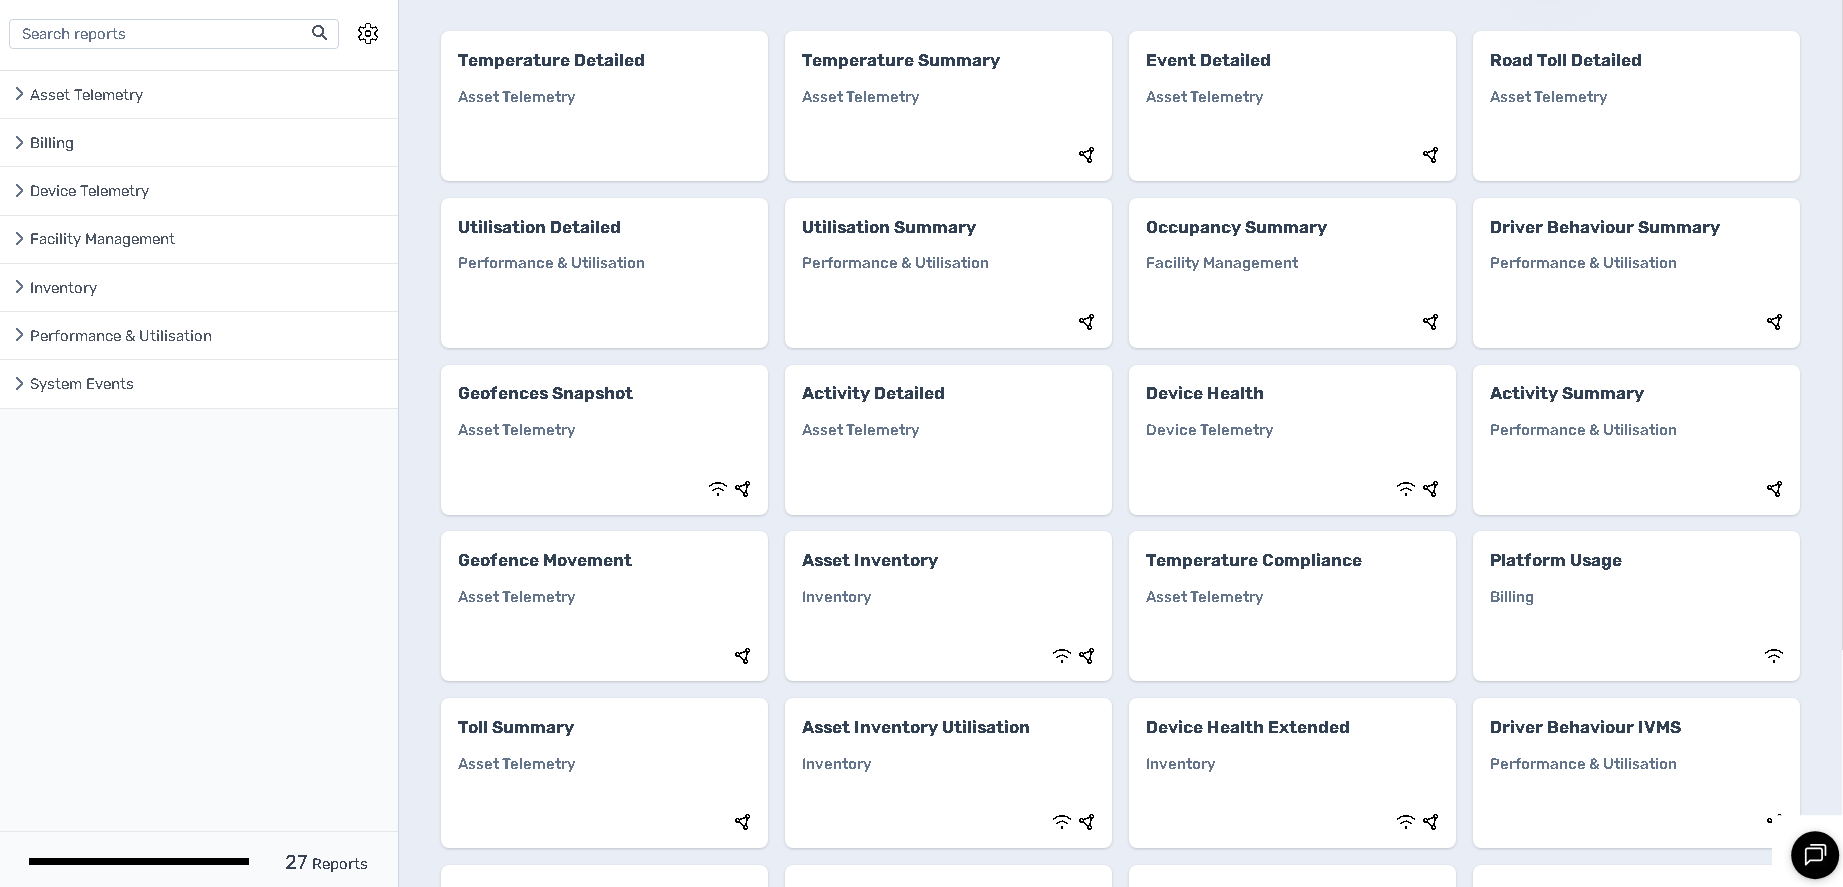
Card View (Right Panel)
The right panel displays all reports as individual cards grouped by their functional category.
Each card contains:
-
Report Title – The name of the report (e.g., “Utilisation Detailed”).
-
Category Label – Indicates the data source (e.g., Asset Telemetry, Inventory).
-
Icons:
-
Share Icon ( ) – Used to share the report or create a scheduled export.
-
Connection Icon ( ) – Indicates a live data connection or auto-refresh capability.
-
You can click any card to open the full report.
Running and Exporting Reports
Once a report is selected:
-
Define your filters (e.g., time range, assets, site, or geofence).
-
Click Run Report to generate results.
-
Use the Export button (top-right corner) to download data in CSV or PDF format.
Tip: Regularly used reports can be pinned for quicker access in future sessions.
Common Report Use Cases
-
Asset Utilisation: Identify underused or overworked assets by comparing utilisation metrics.
-
Device Health: Monitor data communication to detect inactive or faulty devices early.
-
Geofence Movement: Track assets entering or leaving operational zones.
-
Temperature Compliance: Ensure regulatory standards are maintained for cold-chain assets.
-
Toll Summary: Analyse toll route usage and allocate operational costs accurately.
Best Practices
-
Enable only the reports relevant to your operational domain to reduce clutter.
-
Schedule automatic exports for recurring reports (e.g., weekly utilisation summaries).
-
Use filters consistently to maintain report accuracy across teams.
-
Combine reports with Dashboards for a visual summary of key operational metrics.
Summary
The Reports module consolidates data from across Perspio into structured, exportable, and actionable insights.
By leveraging filters, categories, and automation tools, users can monitor operations, track performance, and maintain compliance with minimal manual effort.