The following menus are used to view your Tenant Inventory, Paid Invoices and Consumption. This is useful to see how you are consuming Perspio and easily access your paid invoices.
Tenant Inventory
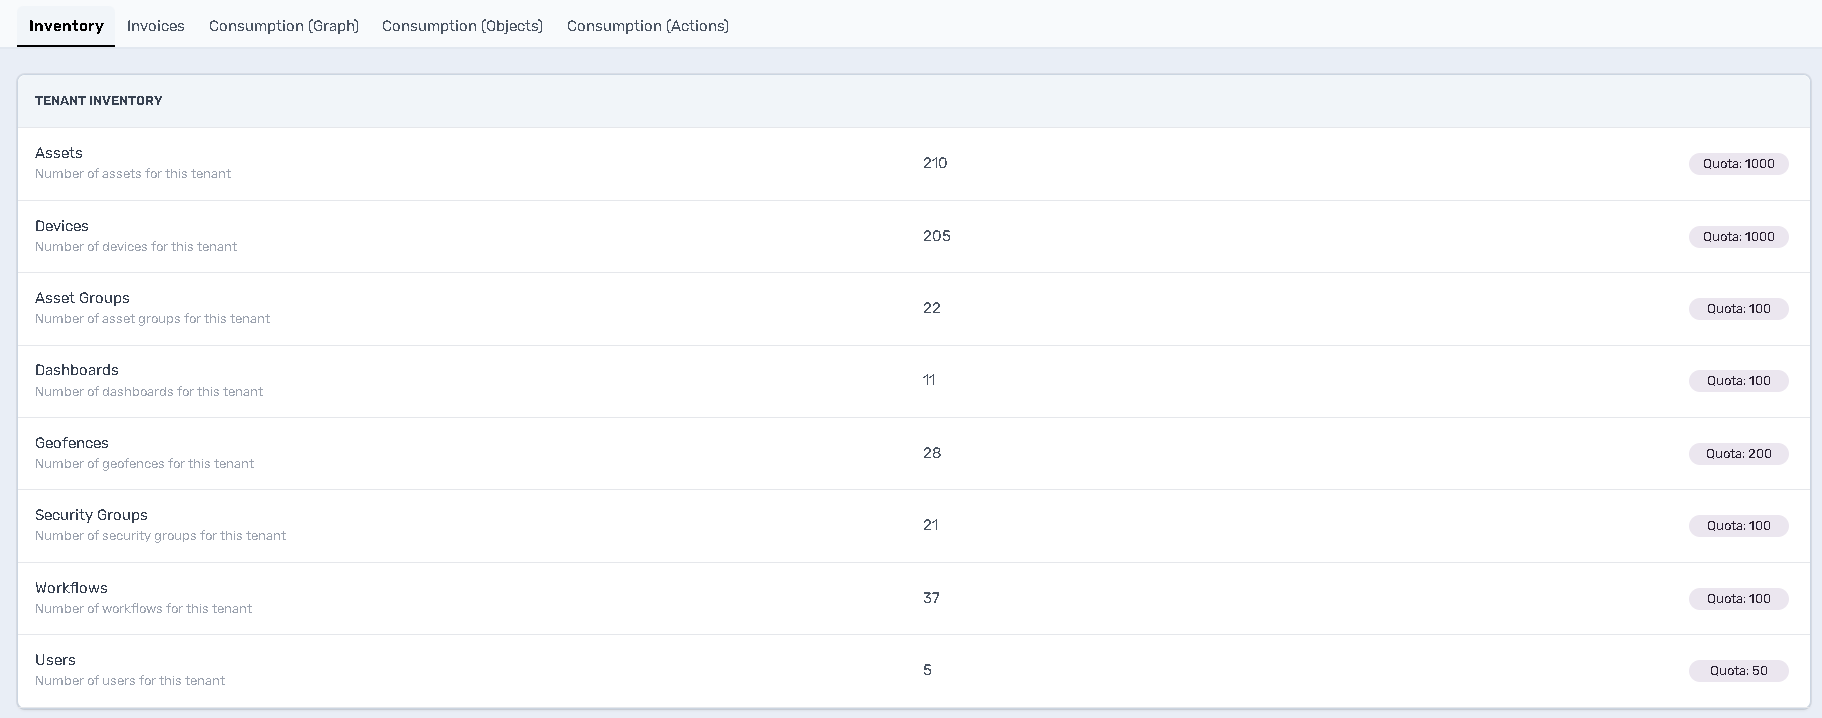
This screen displays important metrics that may affect your billing and help you keep track of every tenant’s usage and assets at a glance.
On the Inventory tab, you’ll see a breakdown of your Tenant Inventory, including:
-
Assets: Total assets assigned to this tenant
-
Devices: Number of connected devices reporting data
-
Asset Groups, Dashboards, Geofences, Security Groups, Workflows, and Users: Counts of each configuration element in use
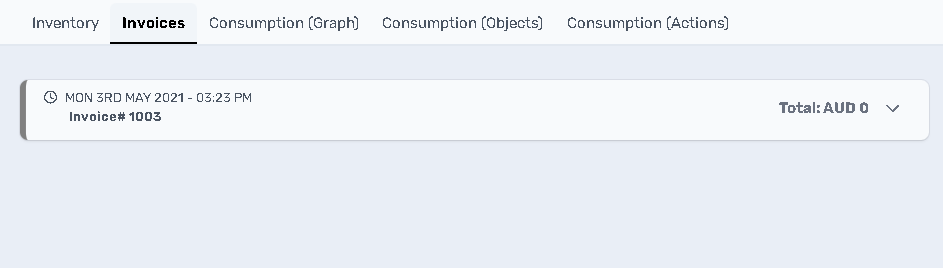
Invoices
This screen gives you a clear, chronological record of all your billing events—each entry shows the invoice date and time, the invoice number, and the total amount paid. By keeping your most recent and past invoices front and centre, you can quickly verify charges, reconcile your account, and ensure your Perspio usage stays within budget.
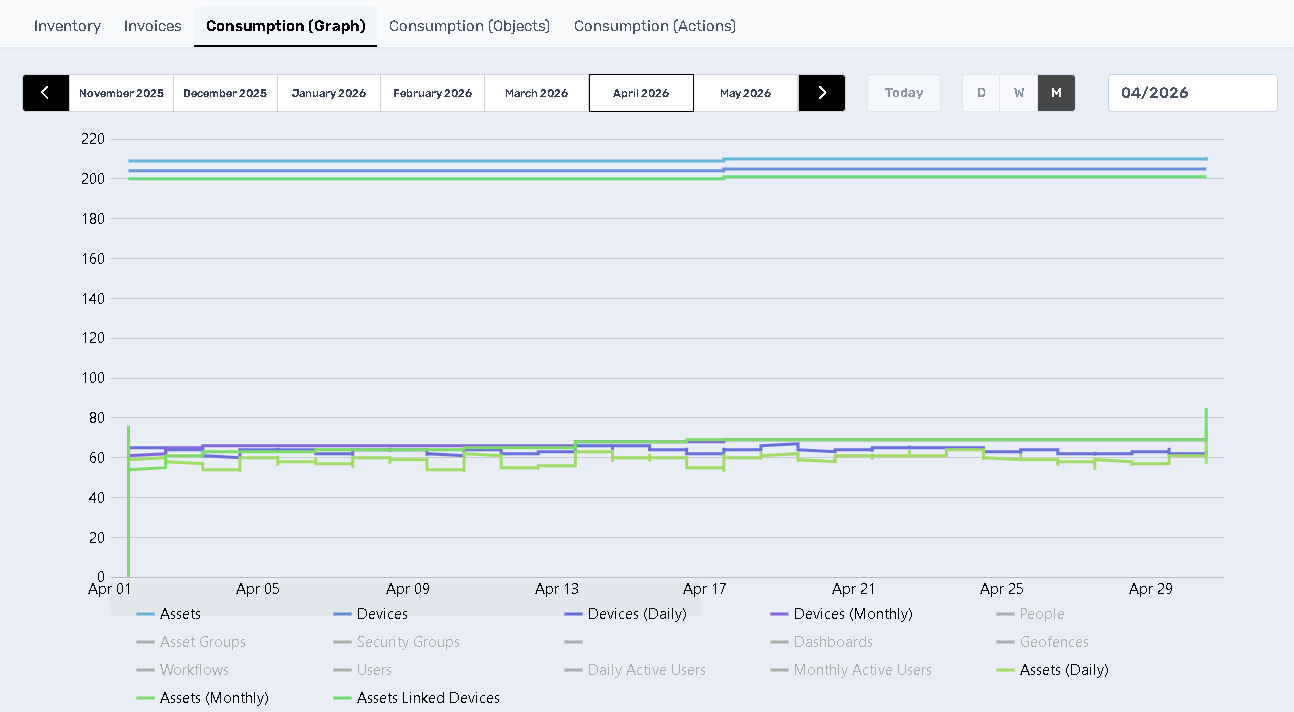
Consumption Graph
This screen visualizes your key usage and activity metrics over time, letting you spot trends and anomalies at a glance. At the top, the date navigator and zoom handles let you move between months (or toggle to day/week views) and focus on specific periods. Below, each coloured line or dot represents a different metric—Assets, Devices, Active Users (daily/monthly), Workflows, Geofences, Dashboards, and more—so you can:
-
Track how your asset count and linked devices evolve day-to-day.
-
See peaks in active users or device connectors.
-
Monitor the growth of configuration elements like geofences and security groups.
Hover over any point to view the exact value and timestamp. By correlating spikes or dips across these series, you’ll understand which activities are driving usage—and optimize your Perspio resources and costs accordingly.
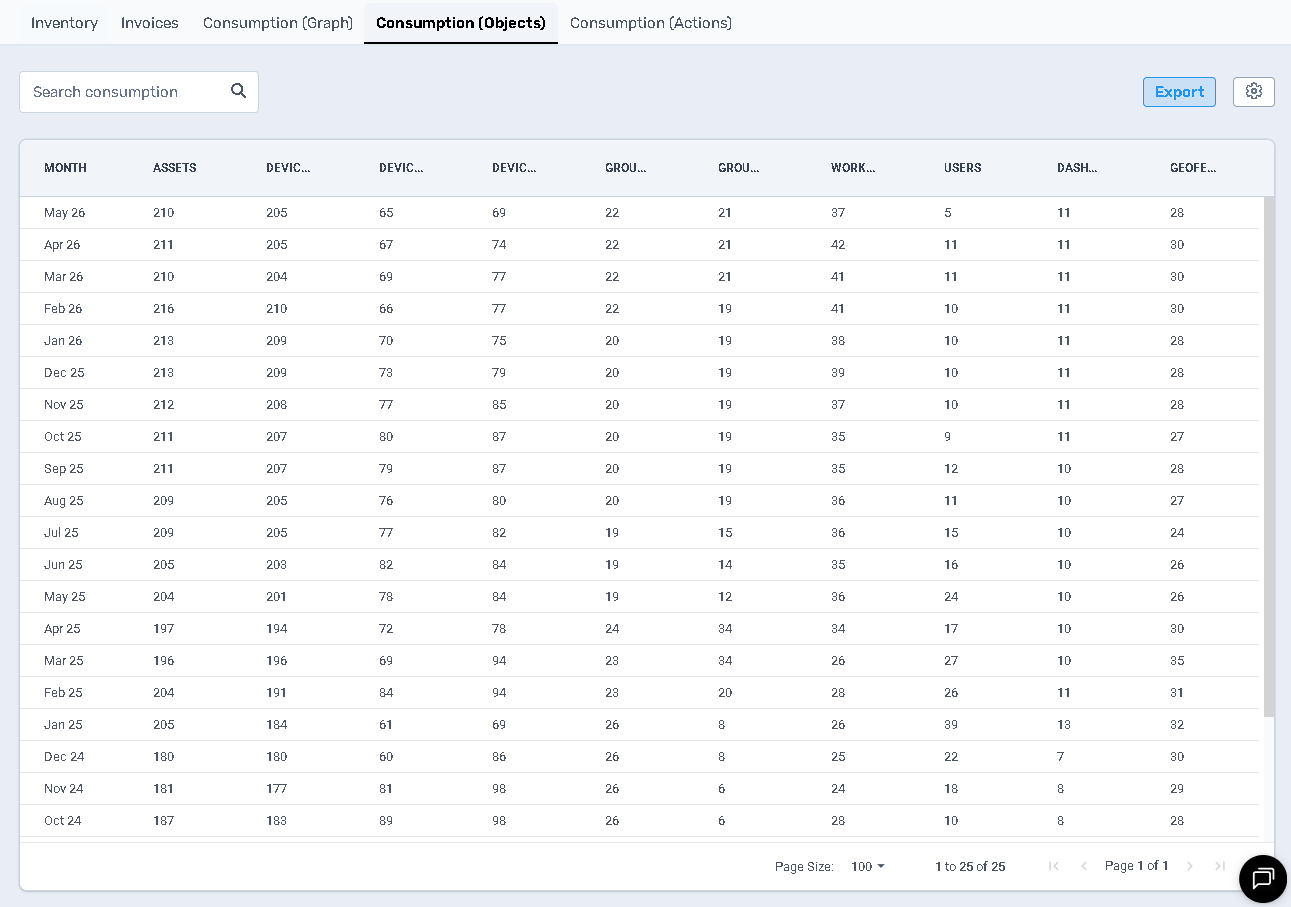
Consumption (Objects) Table
This view presents a detailed table of your Perspio usage metrics over the last 3, 6, and 12 months. It offers a clear breakdown of key indicators such as Assets, Devices, Users, Asset Groups, and more—along with their respective activity levels.
This format makes it easy to compare growth or changes over time, helping you track trends, identify periods of increased usage, and make informed decisions around billing, resource allocation, and system optimisation.
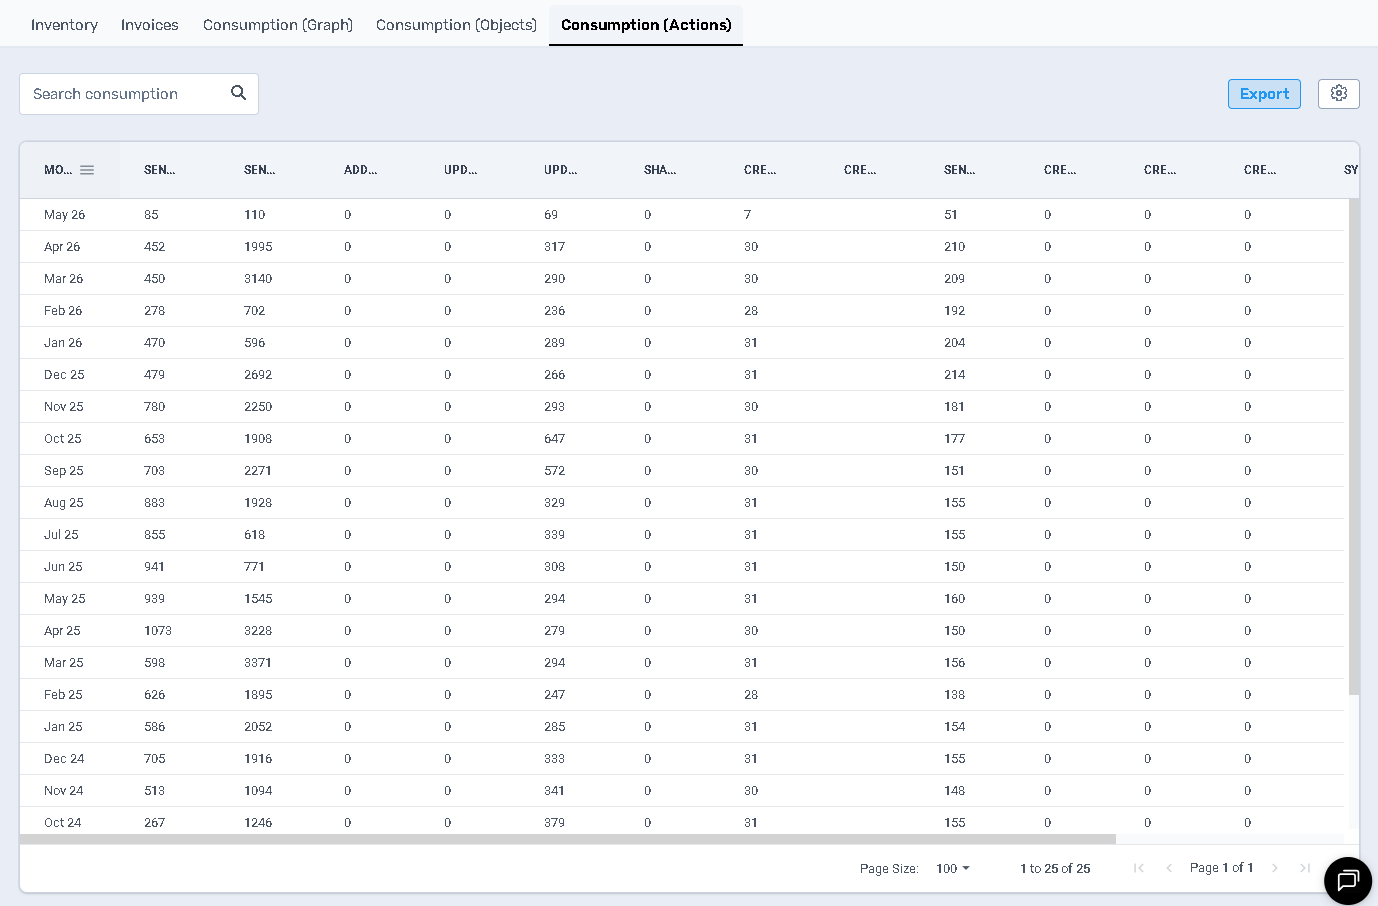
Consumption Actions
This table provides a detailed breakdown of your Perspio Actions consumption over a selected period. It displays the number and types of actions executed—such as automations, alerts, notifications, and integrations—helping you monitor platform activity and understand where your usage is concentrated. This information is essential for optimising workflows and forecasting usage, managing costs more effectively.