
Key Features
-
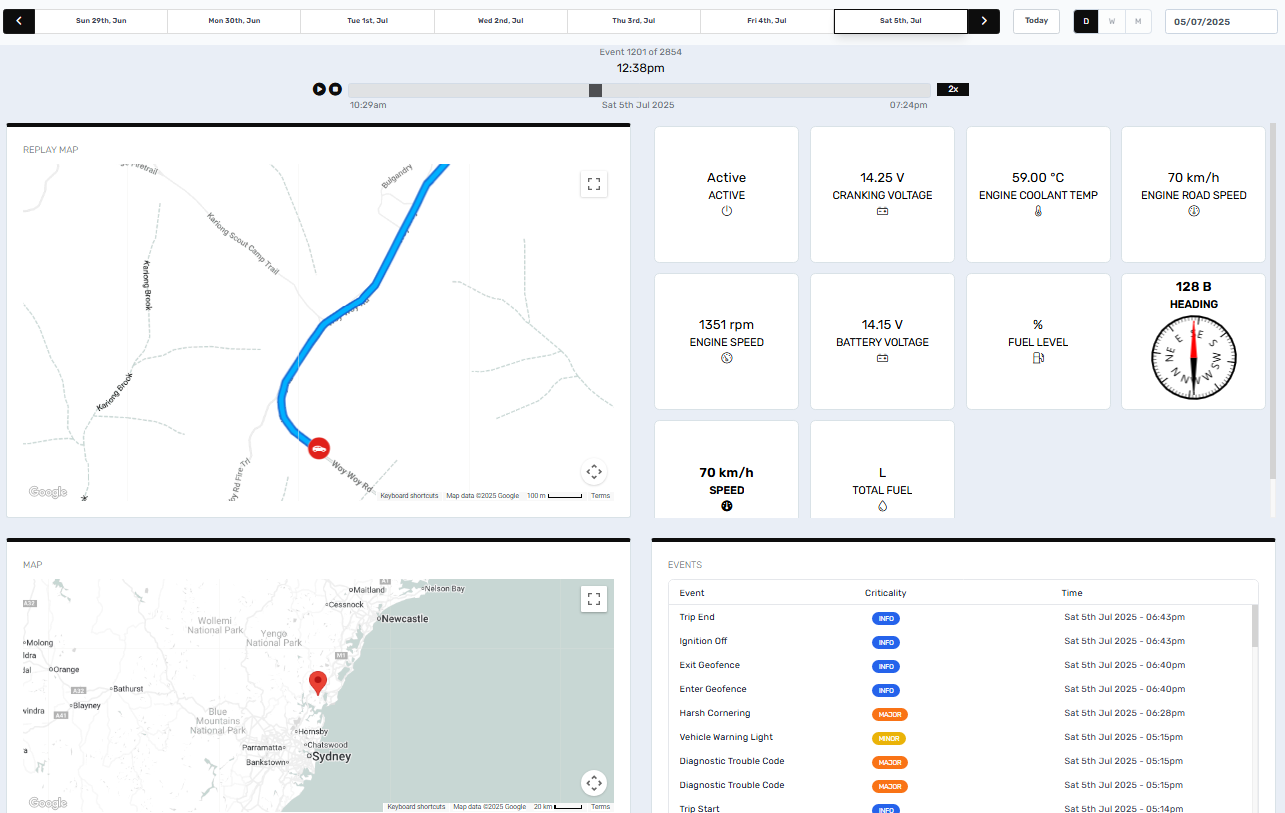
Replay Map: Displays the asset’s travelled path on a street-level map. Directional arrows highlight the direction of travel, with icons for key events (e.g. engine faults, ignition state changes).
-
Timeline Bar: A horizontal bar marks the flow of events throughout the day. Users can drag the selector to move through time or click directly on the bar to jump to a specific timestamp.
-
Sensor Snapshot Panel: Shows point-in-time telemetry values including cranking voltage, speed, RPM, coolant temperature, fuel level, and heading.
-
Event Log: Lists recorded events with timestamp, severity (e.g. INFO, MINOR, MAJOR), and description. Events update dynamically as the timeline progresses.
-
Geographical Map View: Displays the broader area for route context, useful for regional tracking and geofence validation.
Screen Controls
The interface provides several tools to navigate and configure the History Replay view:
| Control | Description |
|---|---|
| Date Selector | Choose a specific date for playback. Use the arrows to scroll across dates. |
| Timeline Bar | Drag the slider to browse through the day’s telemetry stream. |
| Time Stamp Label | Located above the timeline bar, it displays the exact time of the selected data point (e.g. “10:45am”). |
| Event Index Counter | Shows which event is currently selected (e.g. “Event 249 of 1007”). |
| Today Button | Instantly returns to the current date’s activity. |
| View Mode Toggle (D/W/M) | Changes the navigation window to Day, Week, or Month. |
| Calendar Input | Type or select a specific date directly (format: dd/mm/yyyy). |
| Map Zoom / Pan | Use mouse or touchpad to zoom in/out or drag to reposition the map. |
| Metric Cards | Live-updating values (e.g. speed, RPM, voltage) tied to the selected timestamp on the timeline. |
| Compass Display | Indicates vehicle heading at that moment in time. |
All values and map positions are synchronised to the timestamp selected via the timeline or event log.
Dynamic Data Display
The metrics visible in History Replay—such as Engine Speed, Fuel Level, Cranking Voltage, GPS Speed, or Coolant Temperature—depend on three key factors:
-
Device Type: Different makes/models expose different data points (e.g. OBD, CAN bus, external sensors).
-
Data Ingested: Only the data actively ingested from the telemetry feed will be replayed.
-
Assigned Schema: Schemas define how telemetry is mapped and displayed per asset category (e.g. vehicle, generator, trailer).
If a metric is not appearing, verify that the asset is using the correct schema and that the device is configured to report the required parameters. Metrics will vary according to device, asset make/model and schema applied.
Use Cases
-
Incident Review: Analyse movement and telemetry leading up to a fault code, safety event, or geofence breach.
-
Compliance Audit: Validate that operational activities (e.g. deliveries, equipment use) occurred at expected times and locations.
-
Driver Behaviour Monitoring: Identify harsh acceleration, idling, or overspeed events, correlated with map position.
-
Diagnostics Support: Correlate sensor values at the time of Diagnostic Trouble Codes (DTCs) to better understand root causes.
Summary
The History Replay menu enables a detailed playback of asset activity, combining spatial, temporal, and telemetry insights. It is ideal for investigations, audits, and operational reviews. For support with configuring your assets for replay or troubleshooting data visibility, please contact servicedesk@perspio.io.