
This menu is divided into three main tabs: Summary, Details, and Chart, each offering different visualisations and levels of insight.
Sidebar Navigation
On the left-hand panel, users can find the navigation menu, where "Events" sits among other key modules such as Snapshot, Asset Details, Metrics, Utilisation, History Replay, ERP History, and Servicing. This structure ensures seamless access across related asset insights.
Top Menu Bar
The top section of the Events screen includes filters for:
-
Event Filter: Allows filtering by specific event types.
-
Criticality Toggles: Users can refine visibility to only display events marked as Critical, Major, Minor, Info, or Verbose.
-
Date Picker and Navigation: Users can browse events by month, week, day, or jump to the current date.
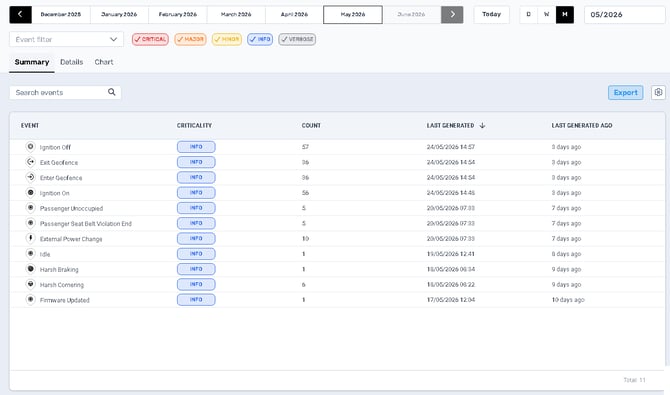
Summary Tab
This tab provides an aggregated table view of events triggered by the asset, including the following columns:
-
Event Name: The type of event triggered (e.g. Trip End, Engine Fault, Harsh Cornering).
-
Criticality: Displays the severity level of the event using visual badges.
-
Count: Indicates how often each event occurred in the selected timeframe.
-
Event Category: Classifies the event type (typically "Asset").
-
Last Generated: Shows the most recent occurrence of each event.
The search bar within this tab allows users to quickly locate specific events by name. An Export button allows the download of the table for offline reporting or integration with external tools.
Details Tab
The Details tab offers a chronological log of individual event occurrences with extended context for each entry:
-
Event Header: Displays the timestamp, event name, and severity.
-
Geolocation Snapshot: Includes a map pinpointing where the event took place, powered by Google Maps.
-
Metadata Fields: On the right-hand side, users can view technical parameters such as:
-
SPM Code
-
Identifier
-
Description
-
Error Code
-
Error Details (e.g. diagnostic trouble codes)
-
Severity level
-
This tab is especially valuable for mechanical diagnostics and maintenance workflows, enabling pinpointing of fault locations and root causes.
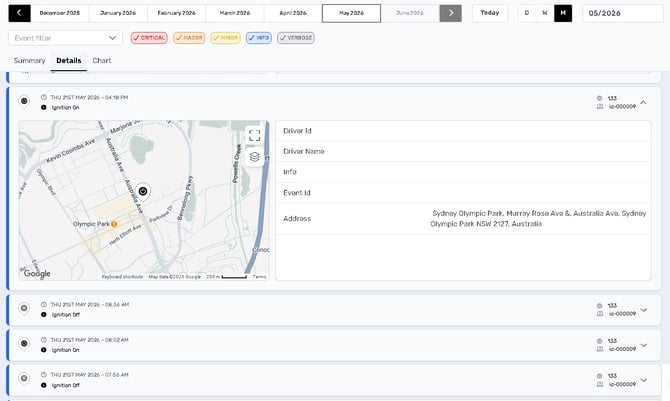
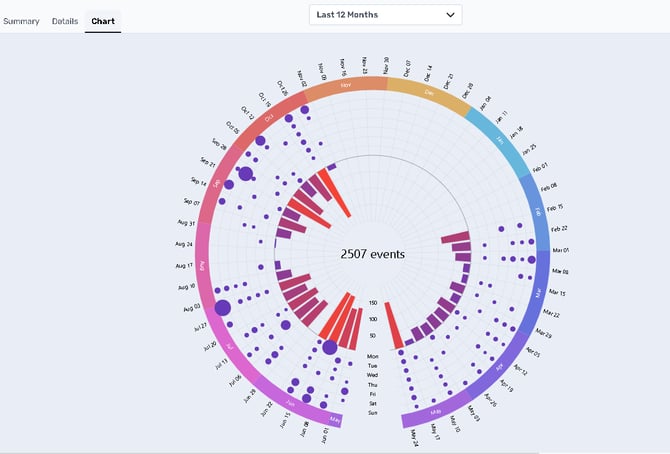
Chart Tab
The Chart tab visualises the distribution of asset events over time through a radial heatmap.
-
Centre: Displays the total number of events for the selected period.
-
Inner Ring: Represents the volume of events per weekday, highlighting busy operational days.
-
Middle Ring: Displays bars that indicate frequency and severity per day.
-
Outer Ring: Shows the calendar layout (months and days), enabling pattern recognition across weeks and months.
The visual breakdown in this tab is crucial for identifying behavioural or mechanical trends, such as repeated engine faults on specific weekdays, or clusters of driver-related incidents.
Usage and Importance
The Events Menu is instrumental for:
-
Compliance: Monitoring vehicle faults and geofence breaches.
-
Diagnostics: Viewing diagnostic codes in context to reduce vehicle downtime.
-
Driver Behaviour: Assessing harsh driving patterns to inform coaching or compliance actions.
-
Automation: Feeding workflows to trigger alerts, maintenance tasks, or inspections.