
The Device Current State view in Perspio provides a real-time snapshot of each device’s telemetry data. At times, not all fields may appear immediately, or the interface may take a few seconds to refresh as Perspio synchronises with the incoming data stream.
To assist with troubleshooting and deeper data analysis, you can enable the History Enable setting under Device Calibration. This feature allows Perspio to display the entire raw payload received from the device and provides visibility of the message frequency over the past five days — valuable for assessing communication consistency and identifying data gaps.
Why Enable History
Enabling History helps you:
-
View all telemetry data transmitted from the device to Perspio.
-
Diagnose issues when expected values (e.g., ignition, temperature, odometer) are missing or not updating correctly.
-
Analyse message transmission frequency to ensure devices are reporting as expected.
-
Confirm payload completeness after configuration or calibration changes.
1. Click on Configuration

2. Click on Devices

3. Select the Device you wish to Edit

4. Click on Calibration

5. Turn On History Enabled
Click Edit in the top-right corner, switch the History Enabled toggle to Enabled, and click Save to apply changes.
Once enabled, Perspio begins displaying full payload and message frequency data for that device.

6. Click on Messages
Open the Messages tab to display the complete raw payload transmitted from the device.
This includes all properties ingested by Perspio, allowing you to verify:
-
Which data points are being captured and processed.
-
Whether certain parameters are missing or incorrectly mapped.
-
The format and structure of the incoming messages.

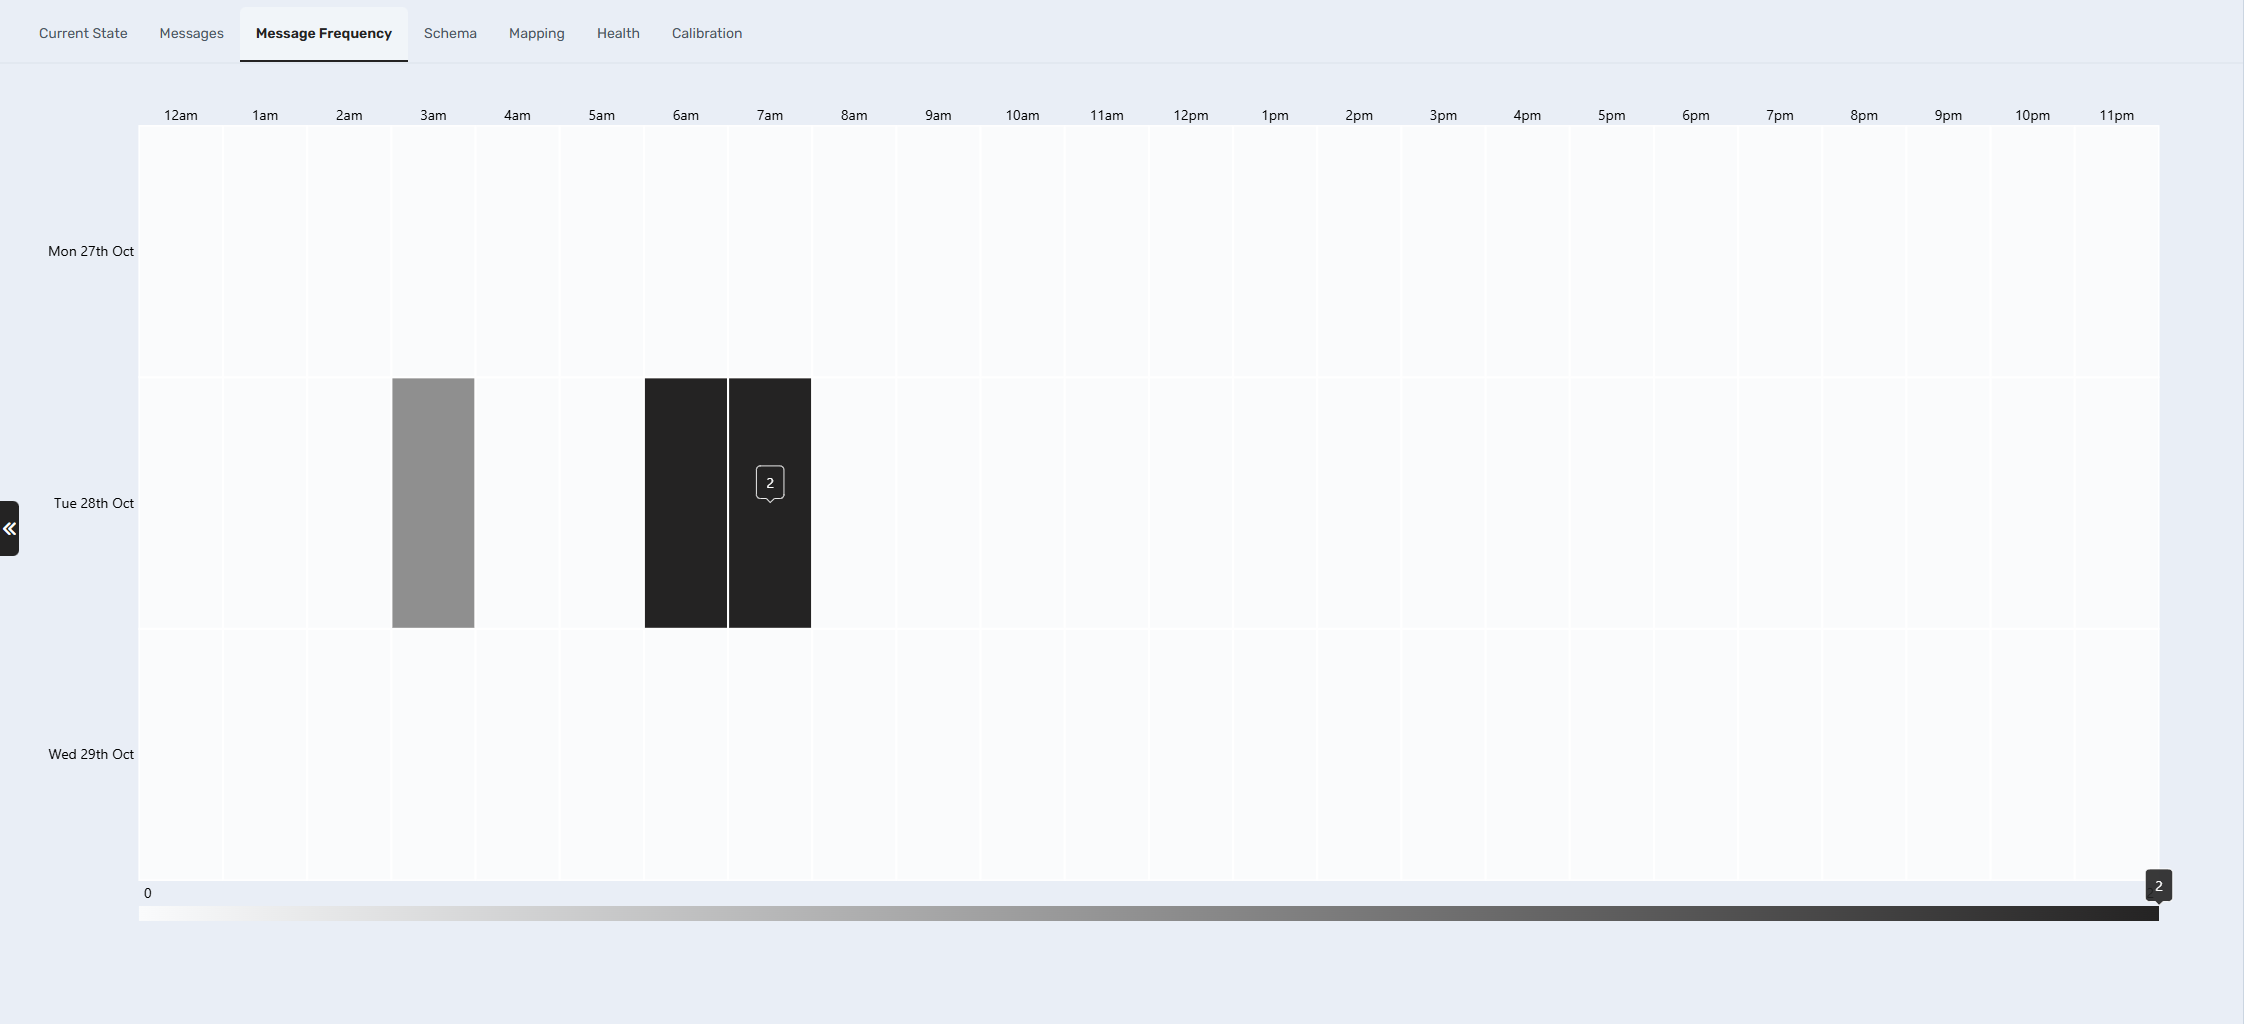
7. Click on Message Frequency
Select the Message Frequency tab to analyse the device’s communication pattern.
This view presents how many messages have been received each hour and day over the last five days, helping identify:
-
Irregular reporting intervals.
-
Periods of inactivity.
-
Potential connectivity or network issues.
Best Practices
-
Use History Enable temporarily during troubleshooting or diagnostics; continuous use may increase data load and processing time.
-
Always verify device health and connection before assuming configuration issues.
-
After completing diagnostics, you can disable History Enable to optimise performance.