
Overview
The Devices Explorer tool lets you query and analyse device-level signals (telemetry and device status) in Perspio. It works similarly to Explorer → Assets, but instead of focusing on an asset record, it focuses on the physical device (or device identifier) that is generating the data.
Explorer → Devices is important because it helps you:
-
Confirm whether a device is reporting data and what the latest values are
-
Troubleshoot installation and connectivity issues (e.g., weak cellular signal, missing sensor readings)
-
Validate integrations and device onboarding (does the device produce the expected signals?)
-
Investigate historical patterns to support incident reviews and root cause analysis
-
Distinguish device problems from asset configuration problems before escalating
Current State vs History: what’s the difference?
Current State
Current State shows a snapshot of the most recent values Perspio has for the selected device signals.
Use it to answer: “What is the device reporting right now (or last known)?”
History
History shows the time-series record of device signals across a selected period (e.g., last X days).
Use it to answer: “How has this device behaved over time, and when did it change?”
Where to find it
-
Open Explorer from the left navigation.
-
Select Devices.
Once inside Explorer → Devices, you configure the query in the left panel, and review the results in the main panel.
Screen layout and controls
Left panel: search configuration
The left panel contains all query inputs and execution controls.
1) Search Mode
At the top of the panel, select a mode:
-
Current State
-
History
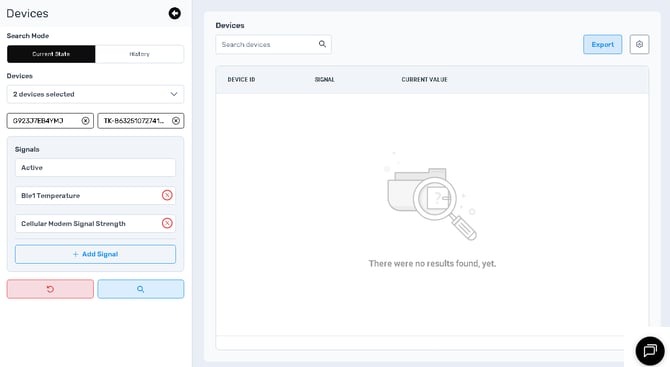
2) Devices selector
The Devices section lets you choose one or more devices to query.
Controls
-
Device dropdown: shows a summary of selected devices (example: “2 devices selected”).
-
Selected device chips: device identifiers displayed as removable chips.
-
Each chip includes an X to remove the device from the selection.
-
Usability
-
Select one device when troubleshooting a specific unit.
-
Select multiple devices when comparing behaviour (e.g., testing new installs or identifying outliers).
3) Signals list
The Signals section defines which device signals you want to retrieve.
Controls
-
Each selected signal appears as a row (examples shown):
-
Active
-
Ble1Temperature
-
Cellular Modem Signal Strength
-
-
Each signal row includes an X to remove it.
-
+ Add Signal button to add additional signals.
Usability
-
Start with at least one health/diagnostic signal (e.g., Active, signal strength).
-
Add the specific sensor/telemetry signal you are troubleshooting (e.g., temperature).
-
Keep selections focused so results remain readable.
4) Query controls (bottom)
Two primary buttons are shown at the bottom of the panel:
-
Reset (red, undo icon): clears selections and returns the configuration to a baseline state.
-
Search / Run (blue, magnifying glass icon): executes the query.
Main panel: results and export
The main panel displays the query output.
Results filter
At the top is a Search devices field used to filter results when the output is large.
Results table (Current State)
In Current State, the table structure includes:
-
Device ID
-
Signal
-
Current Value
Empty state
If a query has not been run yet (or no results are returned), an empty-state message is shown (example: “There were no results found, yet.”).
Export and settings
Top-right controls:
-
Export button (exports the current view)
-
Settings (gear) button (view/table preferences, tenant-dependent)
Using Current State mode
What Current State is best for
-
Verifying the latest device values quickly
-
Checking device health signals (e.g., active flag, cellular strength)
-
Confirming a sensor is reporting (e.g., BLE temperature exists and is populated)
-
Identifying stale reporting (values not changing when expected)
How to run a Current State query
-
Set Search Mode to Current State.
-
Select one or more Devices.
-
Add relevant Signals.
-
Select Search / Run.
-
Review the results table.
Operational guidance
-
If you get no values, confirm the device is online and reporting.
-
If values are present but unexpected, use History to inspect change patterns.
Using History mode
History mode adds time-range and visualisation controls for deeper analysis.
History mode controls (left panel)
When you select History, additional controls become available:
1) View: Grid vs Chart
-
Grid: tabular time-stamped records
-
Chart: time-series visual trend
2) Date Format
Dropdown that controls how the date range is interpreted (example shown: Last).
3) Days
Numeric selector defining how many days of history to retrieve (example shown: 7).
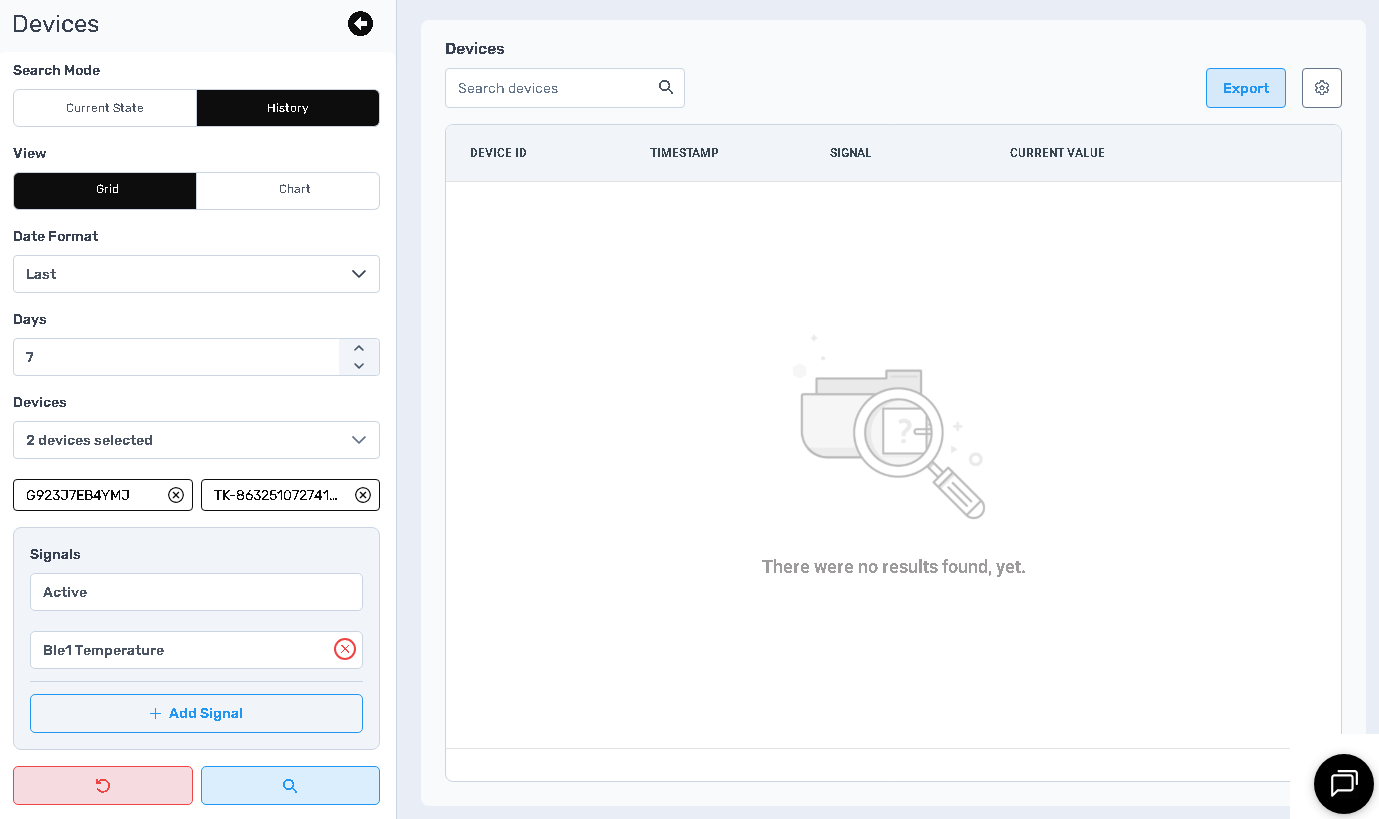
History: Grid view
Grid view presents:
-
Device ID
-
Timestamp
-
Signal
-
Current Value (value at that timestamp)
Best for
-
Incident timelines (“what was the signal at 09:15?”)
-
Auditable evidence and exports
-
Verifying exact change times
History: Chart view
Chart view visualises signal behaviour over time and is best for:
-
identifying spikes/outliers
-
confirming intermittent dropouts
-
detecting gradual degradation (e.g., cellular signal strength decreasing)
-
validating sensor stability (e.g., temperature drift)
Usability tip
-
Keep the chart to a small number of signals and devices for clarity.
-
Use Grid view to validate exact points when the chart suggests anomalies.
Exporting results
Use Export (top-right) to extract results for offline analysis or sharing.
When to export
-
Support ticket evidence (installation troubleshooting)
-
Investigation packs (incident review)
-
Comparing multiple devices in Excel
Recommendation
-
Use History → Grid for exports when timestamps matter.
Common use cases (examples)
1) Device onboarding validation
-
Current State: confirm required signals exist and are populated
-
History: confirm reporting consistency over the last 1–7 days
2) Cellular signal troubleshooting
-
Current State: check Cellular Modem Signal Strength
-
History: identify dropouts and time-of-day degradation patterns
3) Sensor troubleshooting (e.g., BLE temperature)
-
Current State: confirm the temperature signal exists and is non-null
-
History: detect gaps, spikes, or unrealistic readings indicating a pairing/battery issue
4) Differentiating asset vs device problems
If an asset view looks wrong:
-
Use Assets Explorer to confirm asset-level values
-
Use Devices Explorer to confirm what the device is actually sending
This helps determine whether the issue is mapping/configuration vs device reporting.
Best practices
-
Use Devices Explorer when the investigation is about the device itself (connectivity, telemetry availability, sensor behaviour).
-
Use Assets Explorer when the investigation is about business context and asset state.
-
Start in Current State for fast validation; move to History for analysis.
-
Include at least one diagnostic/health signal (e.g., Active, signal strength) in troubleshooting queries.
-
Export History Grid when you need shareable evidence with timestamps.
Troubleshooting
No results found
-
Confirm you selected at least one device and one signal.
-
Confirm the device is expected to report those signals.
-
In History, increase Days to ensure the timeframe includes reporting.
Signals show but values look stale
-
Verify the device is still reporting into Perspio.
-
Use History to confirm when the last update occurred.
Chart looks incorrect
-
Switch to Grid to validate exact timestamps and values.
-
Reduce the number of signals/devices displayed.