---
title: Dashboards Module – Overview
description: Browse and manage Perspio dashboards using visual Cards or a structured List view.
---
[Skip to content](https://help.perspio.io/help/dashboards-1#main-content)
English
Show submenu for translations
Open main navigation
Close main navigation
- English
Show submenu for translations
- [Contact us](mailto:servicedesk@perspio.io)
[Contact us](mailto:servicedesk@perspio.io)
How can we help you?
- There are no suggestions because the search field is empty.
1. [Perspio Help Centre](https://help.perspio.io/help?hsLang=en)
2. [Dashboards](https://help.perspio.io/help/dashboards?hsLang=en)
# Dashboards Module – Overview
## Learn how to use the Perspio Dashboards module. This overview explains Cards and List views, dashboard search and navigation, enabled and filter indicators, table columns, export and settings controls, pagination, access behaviour, and when to use each view.
### Overview
The **Dashboards** module provides a central place to view and manage dashboards in Perspio. Dashboards organise asset, device, telemetry, map, and operational information into configurable widgets so users can monitor the data most relevant to their role.
The module supports two navigation views:
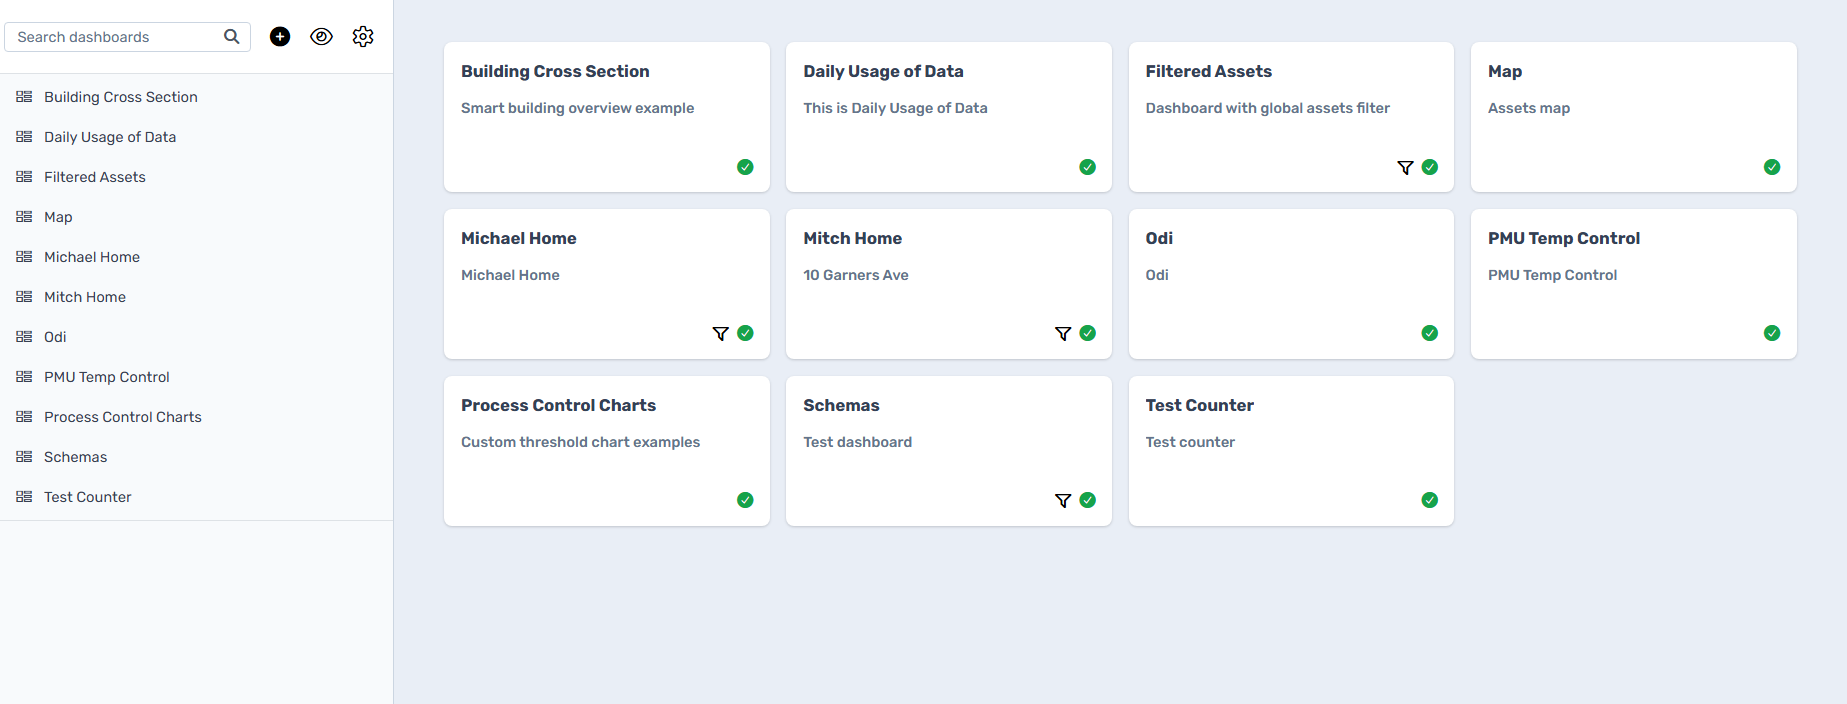
- **Cards** – a visual layout designed for quickly finding and opening dashboards.
- **List** – a structured table designed for reviewing dashboard details, status, widget counts, and update information.
Both views display the same dashboards. Changing the view only changes how they are presented.
---
### Why Dashboards are important
Dashboards bring information from different parts of Perspio into a single operational view.
They can be used to:
- Monitor key asset and device information.
- Display telemetry and operational metrics.
- Review maps, charts, counters, and status information.
- Create role-specific or customer-specific views.
- Reduce the need to open several modules individually.
- Support faster operational decisions.
A dashboard can contain one or several widgets, depending on its purpose and configuration.
---
### Common Use Cases
Dashboards may be configured for:
- Fleet or asset overviews.
- Temperature monitoring.
- Daily data usage.
- Map-based asset visibility.
- Process control and threshold charts.
- Equipment counters.
- Customer-specific operational views.
- Filtered views for selected assets or groups.
The available dashboards depend on your tenant configuration and user access.
---
### Where to find Dashboards
Select **Dashboards** from the left-hand navigation.
The currently selected module is highlighted in the navigation bar. The top breadcrumb shows the module and active view, such as:
**Dashboards → Cards**
or:
**Dashboards → List**
---
### Screen controls
The Dashboards module includes the following controls:
- **View selector – Cards / List**
Switches between the visual card layout and the structured table layout. Changing the view does not change dashboard configuration or availability.
- **Search dashboards**
Filters the dashboards displayed on screen. Use it to search by dashboard name or other searchable information. Clear the field to display all available dashboards again.
- **Dashboard cards**
Available in Cards view. Each card displays the dashboard name, description, and applicable status indicators. Select a card to open the dashboard.
- **Dashboard navigation list**
Available on the left side of Cards view. Provides a compact list of dashboard names for quick navigation.
- **Add button**
The plus icon starts the dashboard creation process, where the user has permission to create dashboards.
- **Visibility control**
The eye icon provides access to display or visibility-related functionality where supported by the tenant configuration.
- **Settings**
The gear icon opens available display, table, or dashboard-management settings. The options shown may depend on the current view and user permissions.
- **Enabled indicator**
A green check on a dashboard card indicates that the dashboard is enabled.
- **Filter indicator**
A filter icon on a dashboard card indicates that filtering has been configured for that dashboard, such as an asset or global dashboard filter.
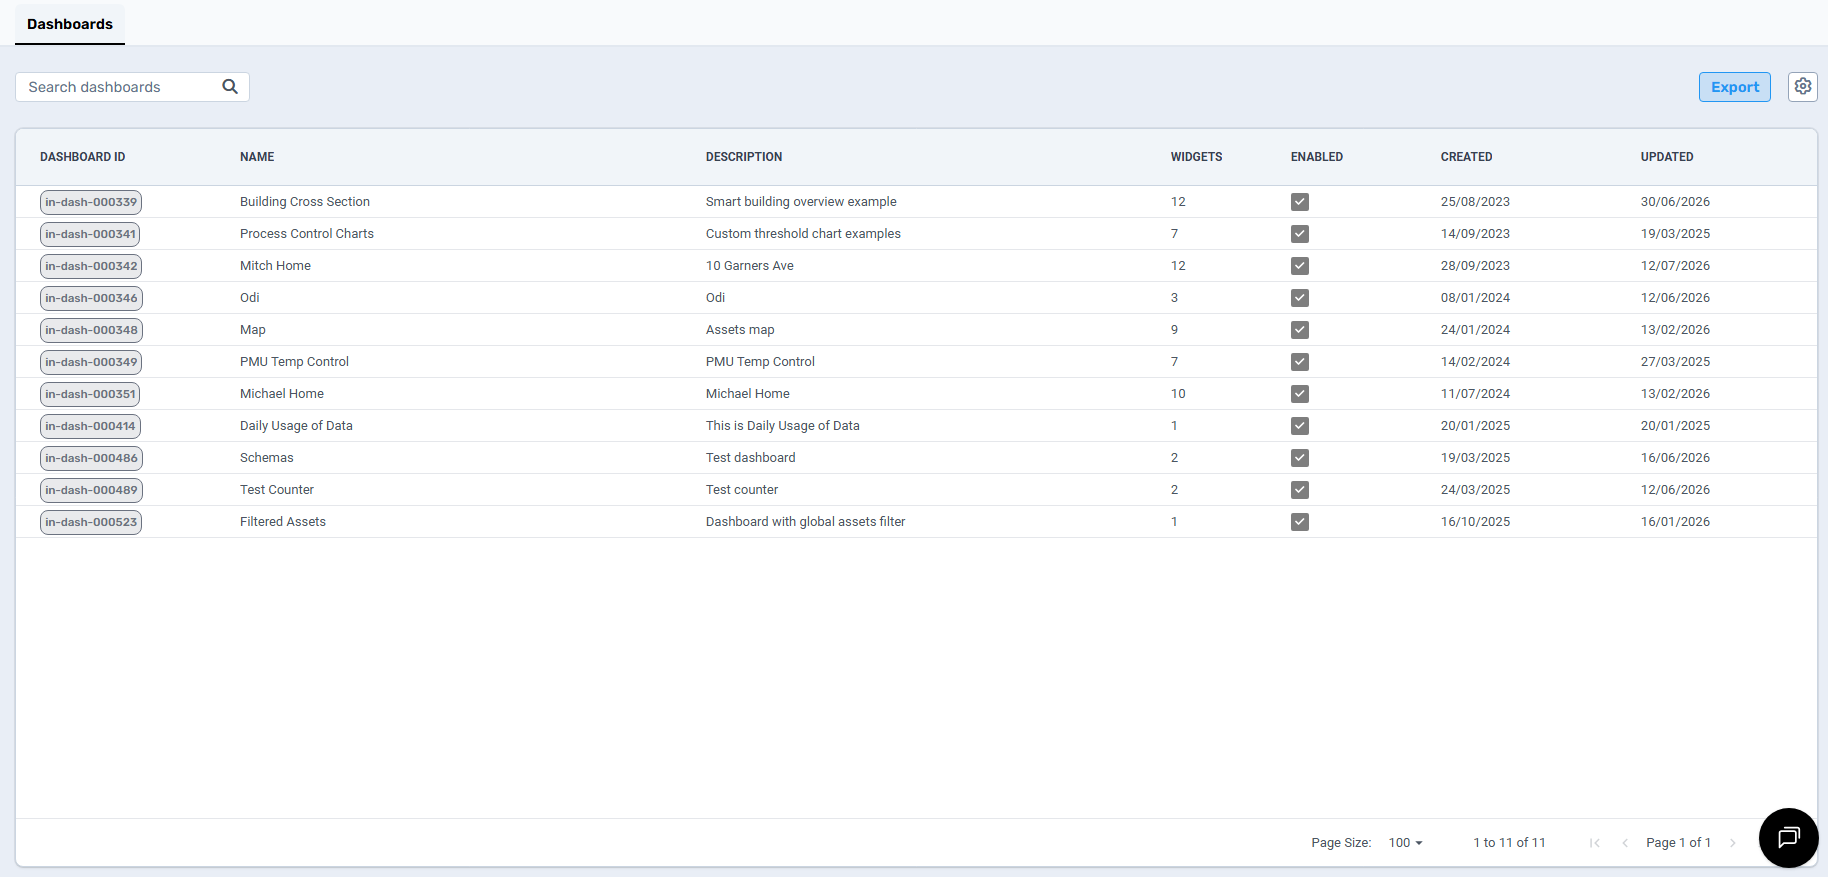
- **Dashboard table**
Available in List view. Displays dashboard records in rows with information such as Dashboard ID, Name, Description, Widgets, Enabled status, Created date, and Updated date.
- **Export**
Available in List view. Exports the dashboard register for external review or record keeping. It exports dashboard information rather than the live data displayed inside dashboard widgets.
- **Page Size**
Controls how many dashboard records appear on each page in List view.
- **Record count**
Shows the number of displayed records and the total number of available dashboard records.
- **Page navigation**
Moves between result pages when the number of dashboards exceeds the selected page size.
- **Favourite star**
Marks the Dashboards page as a favourite where favourites are enabled.
- **Platform header controls**
The top-right header may contain global Perspio controls such as search, filters, status indicators, information, recent activity, and the user profile menu. Availability depends on tenant configuration and user permissions.
---
### When to use Cards view
Cards view is recommended when you want to:
- Open dashboards quickly.
- Browse dashboards visually.
- Read dashboard descriptions before opening them.
- Identify dashboards with filters.
- Confirm which dashboards are enabled.
---
### List view Overview
The **List** view presents dashboards in a structured table. It is useful for administration, auditing, comparing dashboard configurations, and reviewing metadata.
Select **List** from the view selector at the top of the page.
---
### When to use List view
List view is recommended when you want to:
- Review dashboard IDs.
- Compare descriptions and widget counts.
- Check enabled status.
- Review creation and update dates.
- Export the dashboard register.
- Perform a dashboard administration or governance review.
### Cards view vs List view Use Cards when:
- You want a visual browsing experience.
- You want to open a dashboard quickly.
- Dashboard names and descriptions are the main information you need.
- You want to identify enabled or filtered dashboards visually.
### Use List when:
- You need structured dashboard metadata.
- You want to compare several dashboards.
- You need dashboard IDs, widget counts, or dates.
- You want to export the dashboard register.
Switching views does not change the dashboards or their configuration.
---
### Opening a Dashboard
To open a dashboard:
1. Locate it using the search field, navigation list, card layout, or table.
2. Select the dashboard.
3. Review its widgets and available controls.
The contents of the dashboard depend on how it was configured and which assets or data sources are included.
---
### Dashboard access
The dashboards shown to a user may depend on:
- user profile
- module permissions
- customer access
- asset visibility
- dashboard configuration
- whether the dashboard is enabled
A dashboard may be enabled but still unavailable to a user who does not have the required access.
---
### Best practices
- Give dashboards clear and descriptive names.
- Add a short description explaining the dashboard’s purpose.
- Use filters when a dashboard should only display selected assets or groups.
- Review dashboards periodically to confirm they are still required.
- Use List view to identify dashboards that have not been updated recently.
- Avoid creating duplicate dashboards when an existing one can be updated or reused.
- Keep widget counts appropriate so dashboards remain readable and load efficiently.
---
### Troubleshooting
### I cannot find a dashboard
Check that:
- The search field is clear.
- You are using the correct view.
- The dashboard is enabled.
- Your user profile has access to the dashboard and its assets.
### A dashboard appears in Cards but not List
Clear any search or filter currently applied. Both views should display the same dashboards available to your user.
### I cannot create or configure dashboards
Your user profile may have read-only access. Contact an administrator to confirm your Dashboard module permissions.
### A dashboard opens but some widgets show no data
Confirm that:
- You have access to the assets used by the widgets
- The relevant assets or devices are reporting
- Dashboard filters are not excluding the expected assets
- The widget’s data source and time range are configured correctly
### A dashboard has a filter indicator
This means filtering has been configured for the dashboard. Open the dashboard and review the active filter if the displayed assets are not what you expected.
- [Introduction](https://help.perspio.io/help/introduction?hsLang=en#main-content)
- [How to's](https://help.perspio.io/help/introduction?hsLang=en#how-tos)
- [Assets](https://help.perspio.io/help/assets?hsLang=en#main-content)
- [Asset Inspector](https://help.perspio.io/help/assets?hsLang=en#asset-inspector)
- [Utilisation Module](https://help.perspio.io/help/assets?hsLang=en#utilisation-module)
- [Configuration](https://help.perspio.io/help/assets?hsLang=en#configuration)
- [Events](https://help.perspio.io/help/assets?hsLang=en#events)
- [Servicing](https://help.perspio.io/help/assets?hsLang=en#servicing)
- [Asset Configuration](https://help.perspio.io/help/assets?hsLang=en#asset-configuration)
- [Device Configuration](https://help.perspio.io/help/assets?hsLang=en#device-configuration)
- [Explorer](https://help.perspio.io/help/explorer?hsLang=en)
- [Dashboards](https://help.perspio.io/help/dashboards?hsLang=en#main-content)
- [Configuration](https://help.perspio.io/help/dashboards?hsLang=en#configuration)
- [Reports](https://help.perspio.io/help/reports?hsLang=en#main-content)
- [Available Reports](https://help.perspio.io/help/reports?hsLang=en#available-reports)
- [Groups](https://help.perspio.io/help/groups?hsLang=en#main-content)
- [Security Groups](https://help.perspio.io/help/groups?hsLang=en#security-groups)
- [Asset Groups](https://help.perspio.io/help/groups?hsLang=en#asset-groups)
- [Geofences](https://help.perspio.io/help/geofences?hsLang=en)
- [Workflows](https://help.perspio.io/help/workflows?hsLang=en)
- [Administration](https://help.perspio.io/help/administration?hsLang=en#main-content)
- [Settings Module](https://help.perspio.io/help/administration?hsLang=en#settings-module)
- [Admin Panel](https://help.perspio.io/help/administration?hsLang=en#admin-panel)
- [Devices](https://help.perspio.io/help/devices?hsLang=en#main-content)
- [Troubleshooting](https://help.perspio.io/help/devices?hsLang=en#troubleshooting)
- [Installation Guides](https://help.perspio.io/help/devices?hsLang=en#installation-guides)
[](https://perspio.io)
2/50 Yeo St, Neutral Bay NSW 2089
[mailto:servicedesk@perspio.io](mailto:servicedesk@perspio.io)
Copyright © 2026 Inauro