
UI (User Interface)
Perspio’s UI comes in two flavors—PerspioWeb and PerspioMobile—providing an intuitive experience for visualising real-time asset data, configuring settings, and managing platform features. PerspioWeb offers a full desktop experience with role-based access controls, letting administrators, managers, and field users see only what they need. PerspioMobile delivers streamlined maps and snapshots on the go, enabling in-field teams to inspect assets, view recent telemetry, and trigger service actions from their devices.
Key UI Components:
-
Map & Asset Snapshots: Click any asset pin to open its snapshot page, summarising location history, meter readings, documents, and custom counters.
-
Search & Filter: Use the magnifier icon to perform live proximity searches, historical condition searches, and quick asset lookups across your entire fleet.
- Data Explorer: Use this module to access a unified analytics workspace where Asset Details and Telemetry become actionable intelligence.
PerspioMobile Apple Store Link (iOS).
PerspioMobile Play Store Link (Android).
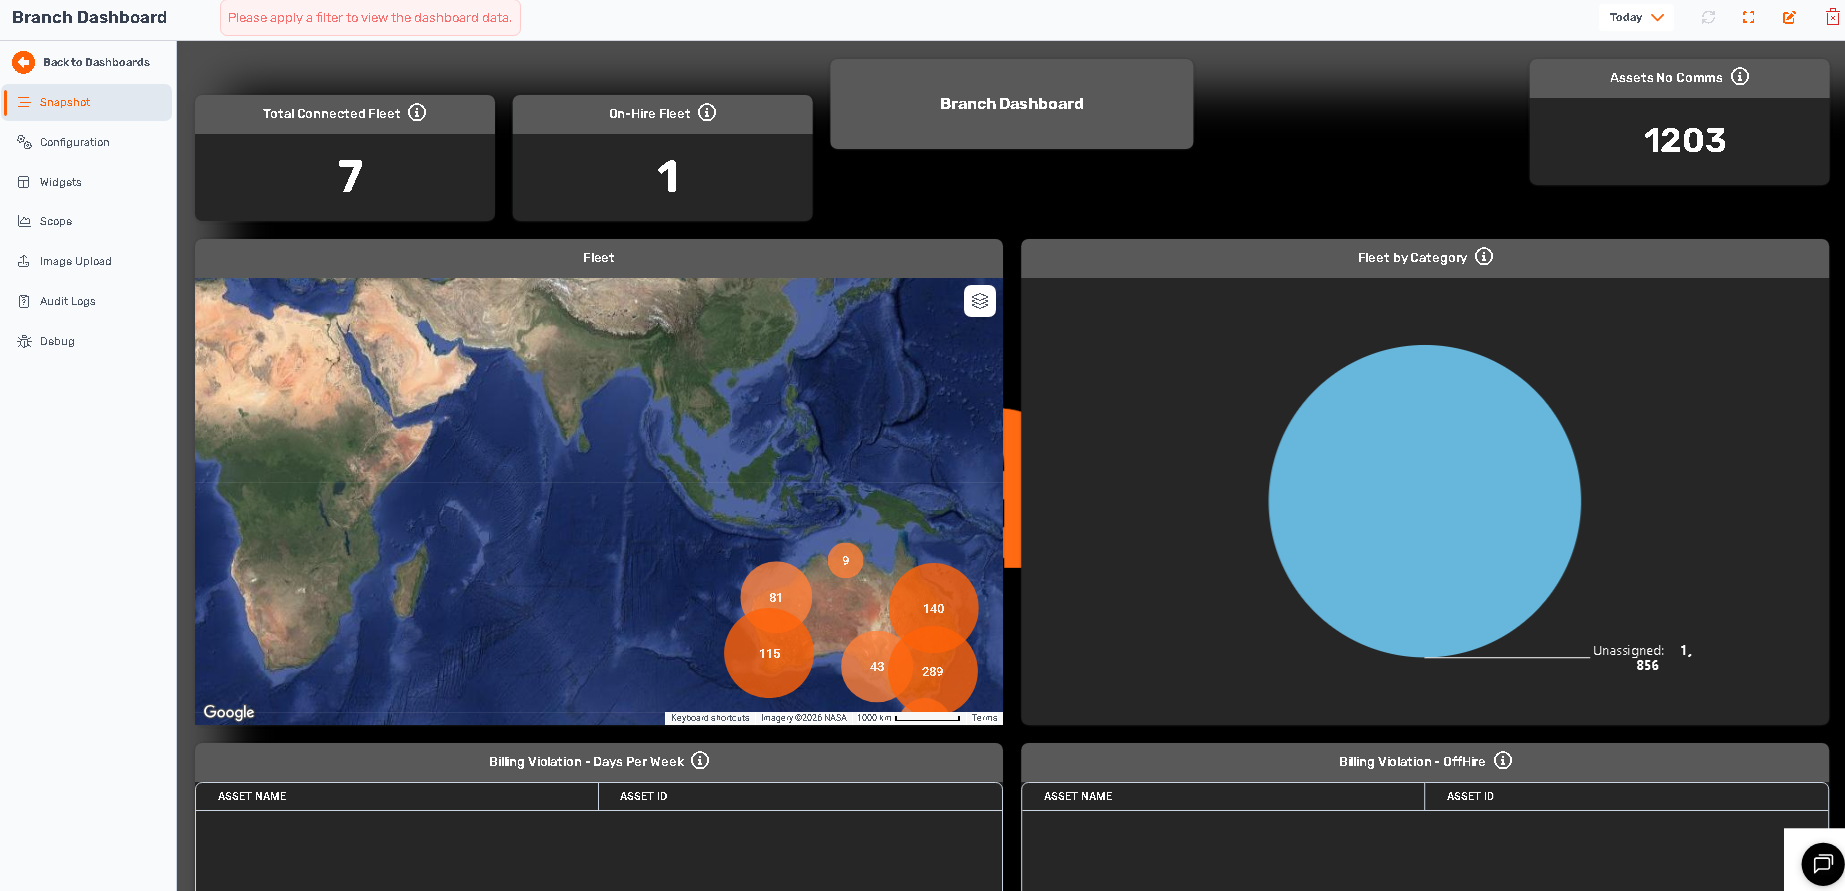
Dashboards
Dashboards in Perspio are fully customisable canvases that aggregate widgets—maps, charts, tables—into a single view for at-a-glance monitoring of critical metrics. You can build dashboards for any use case: site utilisation, high-temperature alerts, battery health summaries, or hybrid overviews combining asset details and telemetry trends. Since Perspio Dashboards not only cover telemetry data that makes them more powerful and contextual for decision making.
A good example is being able to bring contract and hire status from ERP Systems into assets, then leveraging that information on creating dashboards.
Creating & Customising Dashboards:
-
Navigate to Dashboards (pin icon under Home) and click Add Dashboard - More information here.
-
Choose widgets: Map, Line/Bar Chart, KPI Tile, Data Table, etc., then configure data sources (assets, devices, reports) and refresh intervals.
-
Arrange and resize widgets via drag-and-drop; apply filters or group by asset tags to refine your view.
-
Save and share dashboards with teams—optionally locking down edits or setting view-only permissions.
Reports
Perspio’s Reports menu provides on-demand and scheduled exports of predefined data sets—trip logs, service histories, custom counters, and more. Reports come pre-loaded and can be triggered directly from the UI. For more info, access this article.
Running & Scheduling Reports:
-
On-Demand: Go to Reports in the Admin menu, select a report template, set date/time filters, and click Run.
-
Scheduled: Create a schedule (daily/weekly/monthly), specify recipients and formats (CSV, XLSX), then Perspio will email the report automatically.
-
API Access: Use the
Get Report Dataendpoint to integrate report outputs into your BI tools or data lake. More information on this Link.
Extending Reports:
If a pre-built report doesn’t meet your needs, simply open a support ticket describing the fields and filters required—our team can build and deploy a custom template for your tenant.
Workflows
Workflows automate your response to asset events by defining triggers (e.g., battery low, geofence breach), conditions (AND/OR logic), and actions (emails, SMS and other external actions). They ensure critical events are surfaced and handled without manual intervention.
Building Workflows:
-
Click the Hierarchy Icon → Workflows, then Add Workflow - More info found here.
-
Define Trigger: choose an event source (asset trip start, custom counter threshold, telemetry anomaly).
-
Set Conditions: combine multiple criteria (e.g., Temperature > 75 °C AND Asset Status = Active).
-
Configure Actions: send email, SMS, webhook, or push device configuration commands.
Usage Tips:
-
Test workflows on a subset of assets before broad deployment.
-
Utilize checkpoints to pause and review complex logic paths manually if needed.
-
Monitor Workflow History Metrics via the API to track execution rates and failures.