
Accessing the Asset Inspector
To access the Asset Inspector:
-
Navigate to the Assets module from the left-hand navigation menu.
-
Click on the Asset Inspector icon (represented by a processor symbol) located just below the Home button.help.perspio.io
This will open the Asset Inspector interface, displaying a map view alongside a list of assets.

Map and List Views
Map View
The map provides a geographical representation of all assets, enabling users to visualize asset distribution and status across various locations. Key features include:
-
Interactive Clustering: Assets located in close proximity are grouped into clusters, which can be expanded to view individual assets.
-
Zoom and Pan Controls: Users can navigate the map to focus on specific regions or assets.
-
Map Themes: Multiple map themes are available, including Satellite, Perspio Dark, and Google Default, catering to user preferences and requirements.
List View
The list view provides a tabular representation of assets, offering detailed information such as asset identifiers, statuses, and locations. Features include:
-
Search Functionality: Users can search for assets by typing at least three characters of the asset name or serial number.
-
Filtering Options: Assets can be filtered based on various criteria, allowing users to focus on specific subsets.
-
Export Capability: The asset list can be exported in Excel or CSV formats for external analysis or record-keeping.
-
View Modes: Toggle between compact and standard list visualizations to suit your preference.
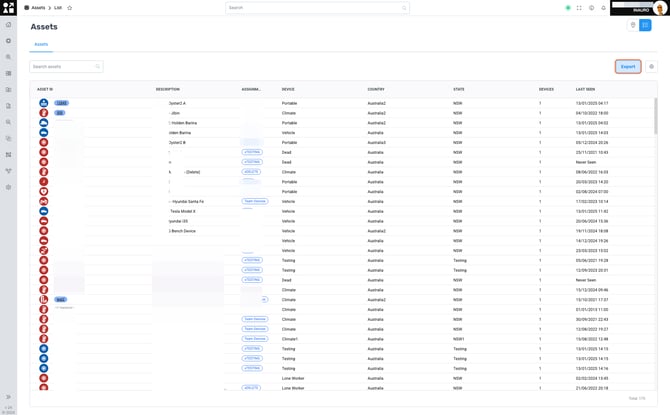
Click the “List” button to open a list containing all your Assets:

Click on “Export” to export this list as Excel or CSV files. Click on the “Cog” to alternate between the Compact or Standard List Visualization.
Colour Coding and Marker Representations
Assets on the map are represented by color-coded markers, each indicating a specific status:
-
Red: No Communication – The asset's device hasn't communicated or sent a heartbeat in over 48 hours.
-
Yellow: Partial Communication – Assets with multiple devices where only one has communicated in the last 48 hours.
-
Blue: Active (Ignition On) – The asset is currently operational with the ignition turned on.
-
Navy: Active (Ignition Off) – The asset is regularly communicating, but the ignition is off.
-
Black: No Devices – Assets without any linked telemetry devices.
These markers provide immediate visual cues about the operational status of each asset, facilitating quick assessments and decision-making. More info here
Live vs. Manual Location Data
Perspio distinguishes between live GPS data and manually set locations for assets:
-
Live Location: Assets equipped with GPS devices transmit real-time location data, which is automatically updated and displayed on the map.
-
Manual Location Override: For assets without GPS capabilities, users can manually set a static location by specifying latitude and longitude coordinates.
This dual approach ensures comprehensive tracking and visibility of all assets, regardless of their telemetry capabilities.
Asset Snapshot Page
Clicking on an asset marker or list entry opens the Asset Snapshot page, providing detailed information, including:
-
Asset Details: Basic information about the asset, such as name, type, and status.
-
Activity: Recent events and activities associated with the asset.
-
Metrics: Key performance indicators and usage statistics.
-
Utilisation: Insights into how the asset is being used over time.
-
Events: A log of significant occurrences related to the asset.
-
History: A chronological record of the asset's operations and movements.
-
ERP History: Integration data from the organization's ERP system.
-
Devices: Information about devices linked to the asset.
-
Configuration: Settings and preferences for the asset's operation within Perspio.
-
Documents: Files and links related to the asset, such as manuals or inspection reports.
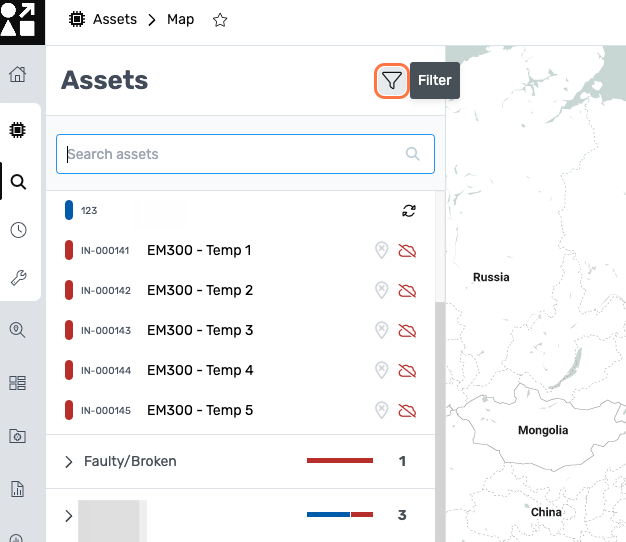
Click this Icon to open the Filters Settings:
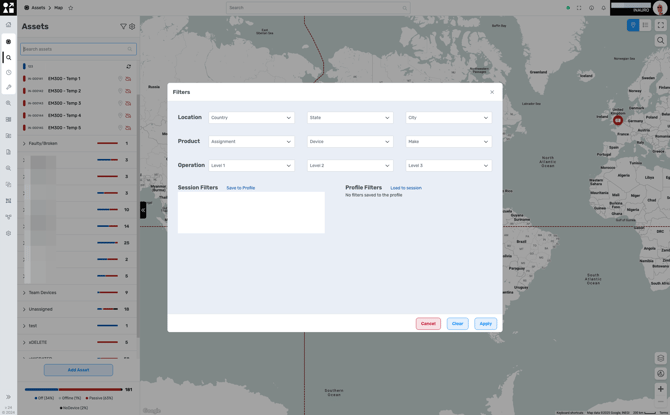
Select or Unselect Filters according to the desired result and click “Apply” to apply the selected filters. Close the Filters screen by clicking “X” on the top right corner.
Filter data is drawn from the Asset Details. You can’t build filters for information that isn’t already captured in an Asset Master field, so please ensure your Asset Master is populated with all relevant details.
Customization Options
Users can customize asset markers by changing icons or colours to better represent different asset types or statuses. To change an asset's marker icon: